The picture below shows the component network used to determine the vignette correction parameters for a particular lens. (Click on the image to view the full resolution version on Flickr.) It requires a photograph of an evenly illuminated plain surface such as a grey card.
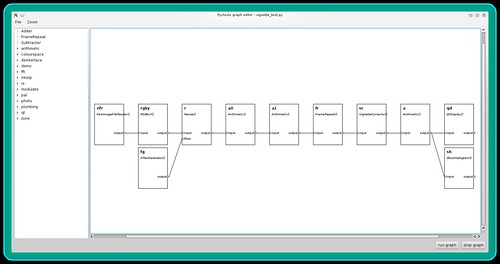
The network contains the following components (from left to right):
RawImageFileReader()— reads the grey image file. This is set to output linear data, i.e. no gamma correction is applied. (If the grey image is not a raw file then an inverse gamma corrector is needed between the file reader and the next component.)RGBtoY()— converts the RGB image to luminance.Resize()— reduces the image size to fit on the computer screen.Arithmetic()— averages the image with its horizontal reflection.Arithmetic()— averages the image with its vertical reflection. These two stages reduce the effect of uneven illumination in the original photograph.FrameRepeat()— converts the still to a video sequence. This allows the vignette corrector parameters to be adjusted "live", with near instant effect on the displayed image and histogram.VignetteCorrector()— applies the radially varying gain.Arithmetic()— boosts the image contrast. This makes any residual vignetting easier to see.QtDisplay()— shows the video. The frame rate is set to 5Hz, as this is fast enough to give feedback as the parameters are adjusted.ShowHistogram()— shows the video's histogram. This helps when adjusting the contrast boost.
Before running the network I open the configuration dialogs of the vignette corrector and contrast booster. This allows these components to be adjusted while the graph is running, as shown below.
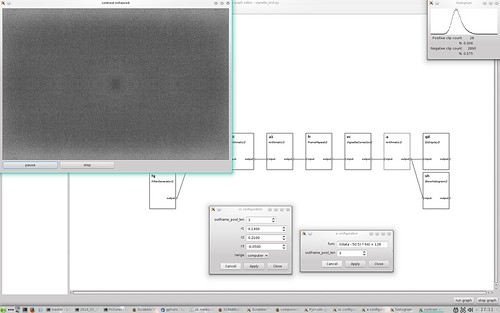
The top left window shows the image after vignette correction, with a contrast boost of 64x in this example. The top right window shows the histogram of this contrast enhanced image. You can see there is still some residual variation in brightness, including an interesting slight darkening at the centre. The lighter patches at top and bottom make it hard to assess the effect of small changes in the vignette corrector settings. However, I think that this result is good enough for all practical purposes.
Automatic parameter setting
Since writing the above I've written software to automate the process. It measures the average level of 50 annular bands of a grey card image, computes the gain required to correct each band, then fits a 3rd order polynomial to the gain and prints out the appropriate vignette corrector settings. The above process can then be used to check the settings.
I've also identified the cause of the slight darkening at the centre of the corrected image. Using a polynomial function does not produce a good fit at zero radius, as shown in this graph.

The blue line is the required gain computed from image data and the green line is the fitted function.
Further reading
The vignette corrector component is written in Python and uses NumPy to do all the hard work. You can view the source code on GitHub and its documentation on ReadTheDocs.org.
Example scripts to determine the corrector settings and to process photographs are also downloadable from GitHub.
No comments:
Post a Comment